What is the source of an indication? Does the reflector result from weld geometry or an actual discontinuity? Once it has been determined that an indication is from a discontinuity, it must be characterized. This process consists of determining the location of the discontinuity by plotting the beam sound path on a cross section of the weld and then observing its signal characteristics.
Plotting Discontinuities
Ninety percent of the battle in discontinuity identification is in knowing where the discontinuity is located. Accurate plots are critical in determining the cross sectional position of a discontinuity. When calibrating an angle beam probe, it is essential to measure the exit point and actual refracted angle since they will both change as the wedge wears. Indications must always be plotted. Relying solely on the surface distance and depth information from the discontinuity detector can often result in misidentifying a discontinuity or mistaking geometry for a discontinuity.
Before plotting, a cross section of the weld must be drawn. A contour gage should be used to record the profile of the weld cap. The geometries of test plates used in most performance demonstration tests are typically very consistent, so obtaining a single profile from the weld cap on any given weld is usually sufficient for plotting all indications. The geometry of field welds however, can be wildly erratic and it is therefore very important to obtain a profile from each indication location when doing field inspections. Using a contour gage will make any mismatch or misalignment plainly evident once the bottom surface is drawn in.
After obtaining a profile of the weld cap, thickness measurements must be obtained on the weld cap and on both sides of the weld. The opposite surface of the part can now be drawn. For single-V welds, a gap of 2.54 mm (0.1 in.) should be left on the far surface. This area is known as the weld root.
It is recommended that fusion lines not be drawn in when examining test plates. Top surface weld toes on test plates often overlap the bevel. Assuming that the bevel is at the toe can lead to incorrectly identifying lack of sidewall fusion as slag.
If a discontinuity is plotted in the root area or in the fusion line, it is likely to be a planar discontinuity such as a crack, lack of fusion, or lack of penetration. If the discontinuity is plotted in the body of the weld, it is likely to be a volumetric discontinuity such as slag or porosity, with a centerline crack being the exception. Many performance demonstration tests only require you to be able to tell the difference between planar and volumetric discontinuities. Additional guidelines include the following.
• Whenever possible, plot indications from both sides of the weld.
• Plot in both the first and second legs.
• Use different angles since the response of an indication to different angles can indicate the orientation of a discontinuity.
Discontinuity Signal Characteristics
Practice is the best way to learn signal characteristics. Kits are commercially available with small plates containing weld discontinuities. Each plate has a different type of weld discontinuity accompanied by a cross section of it. Gain settings should be at reference level and the probe should be moved very slowly when examining signal characteristics. When looking at indication signals, the following questions should be asked:
• Is the signal clean and sharp or is it jagged?
• What happens when the probe is skewed? Does the signal immediately drop away or does it remain?
• What happens when you move the probe towards and away from the discontinuity?
• What angle responds best?
• Are there multiple peaks?
• Are there trailing echoes?
• Are there tip-diffracted signals?
Indications Caused by Geometry
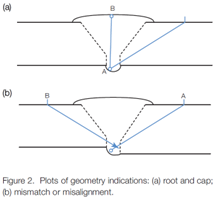
Indications caused by the weld root or weld cap are easy to determine by plotting alone. Another common situation from both the weld root and the weld cap is illustrated in Fig. 2a. Point A occurs when a signal is returned from the root. Point B produces an indication that typically shows up about half way through the second leg. This is caused by the beam hitting the root and then reflecting straight up to the weld cap. This is easily identified because the surface distance reading on the discontinuity detector will put it in the plate on the far side of the weld.
In the case of a mismatch (Fig. 2b), there will be an indication from the weld root geometry from one side of the weld (plot A) and not the other (plot B). With misalignment, the weld root indication will be visible from one side of the weld for half the circumference of a pipe or vessel and from the other side of the weld on the other half.
Slag
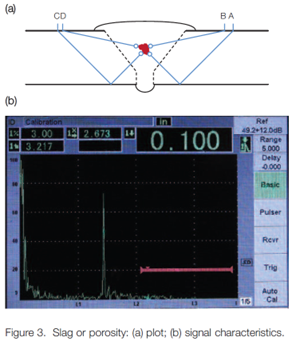
Plot. Depending on the location, slag will plot in the first and second legs (usually in the body of the weld) and should show volume (Fig. 3a). It can sometimes be seen using a 0 degree probe from the weld cap surface. If it plots directly in the centerline, signal characteristics become critical; it could be a centerline crack. Signal Characteristics.
Signal characteristics can be low in amplitude and will usually have a small trailing echo, very similar to one produced by side drilled holes. The signal usually drops off relatively quickly when the probe is skewed.
Porosity
Plot. The plot for porosity is similar to slag (Fig. 3a).
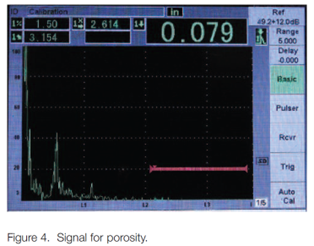
Signal Characteristics. Signal characteristics for porosity are usually a low-amplitude, wide, hashy signal that will remain, or walk when the probe is skewed. Porosity can appear as multiple signals as well. Porosity is probably the easiest discontinuity to miss. Discontinuity detection scans should be conducted 12 dB hot for this reason (Fig. 4).
Centerline Crack
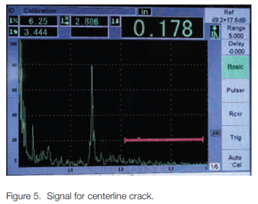
Plot. Centerline cracks will plot the same as slag and porosity (Fig. 3a) except the plots from each side of the weld should be closer together, indicating a narrower discontinuity.
Signal Characteristics. The signal for a centerline crack will likely appear rough and be wider than slag but can be similar to porosity (Fig. 5). When the probe is skewed, the signal will remain and walk a little. Signal discrimination and finite plotting are vital in distinguishing the difference between porosity and sidewall cracks. Porosity usually displays more peaks than a crack.
Lack of Sidewall Fusion (LOSWF)/Sidewall Crack
Plot. As seen in Fig. 6a, lack of sidewall fusion or sidewall cracks should plot in the second leg from the same side that the discontinuity is on (plot A). When looking in the first leg from the same side (plot B), it is typically not visible, although a 70 degree probe can sometimes get a very small signal. Occasionally, when looking from the first leg on the same side, a signal will be received that plots out similar to plot B1. This happens when the beam hits the lack of fusion and bounces straight down to the bottom surface of the plate (plot B2). From the opposite side of the weld, it will not be visible in the second leg and will only be visible from the first leg if the lack of sidewall fusion is low enough toward the weld root (plot C).
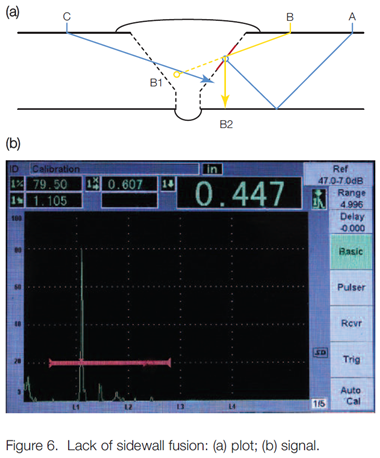
Because the surface of a sidewall crack is rough and faceted, it is probable that the signal will be picked up from some or all of the locations where lack of sidewall fusion can’t be used.
LOSWF Signal Characteristics. Lack of sidewall fusion should be the discontinuity that is easiest to identify. The signal is usually very high in amplitude and very clean and sharp (Fig. 6b). Also, when the probe is skewed, the signal immediately drops straight off instead of walking a little. Because bevels are usually around 30 degrees, the sound beam reflector will typically respond best to 60 degrees (this places the beam at 90 degrees to the discontinuity).
Sidewall Crack Signal Characteristics. The signal for sidewall cracks will likely appear rough and be wider than lack of sidewall fusion. When the probe is skewed, the signal will remain and walk a little. As with lack of sidewall fusion, the signal is typically high in amplitude and responds best to 60 degrees.
Root Cracks and Lack of Root Fusion (LORF)
Plot. Root cracks and lack of root fusion will plot in the root area on one side of the root (Fig. 7a). It is important to plot from both sides of the weld when possible because the plots should show that the discontinuity is on the same side of the root and that it is narrow.
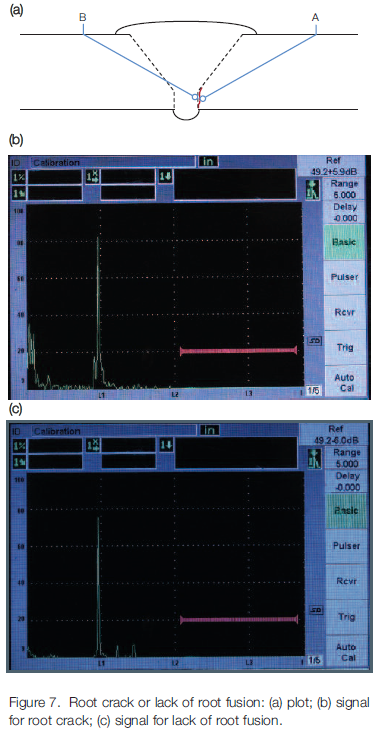
Signal Characteristics. Signal characteristics are the distinguishing factor between root cracks and lack of root fusion, although discerning the difference can still be difficult. However, most performance demonstration tests and the ASME code only require the ability to distinguish planar discontinuities from volumetric discontinuities. With cracks, the facets of the cracks are usually visible along with a tip diffracted signal and when the probe is skewed, the signal will remain longer than the signal for lack of root fusion. The reflector signal will also have a wider base than lack of root fusion. Lack of root fusion characteristics will be similar to lack of sidewall fusion but can be rougher and walk a little more.
Lack of Root Penetration (LOP)
Plot. Lack of root penetration will plot on each side of the root (Fig. 8a) and is typically visible with a 0 degree probe from the weld cap surface.
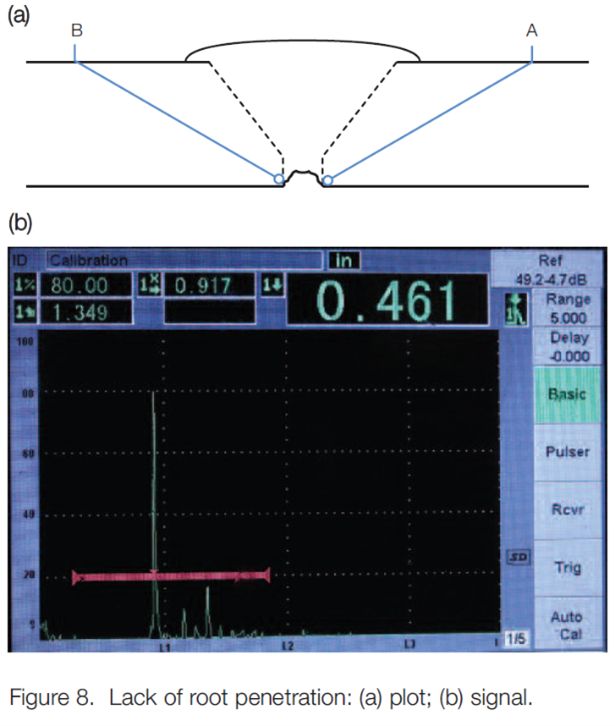
Signal Characteristics. The signal for lack of root penetration typically has a wide base and is high in amplitude. Its signal usually persists briefly when the probe is skewed.
Conclusion
A contour gauge and careful plotting, followed by the detailed discrimination of signal characteristics, will determine the location and reveal the identity of a discontinuity. Additionally, if the proper training pieces are made available to technicians and the steps recommended in this text are followed, the results of industry performance demonstration tests, as well as the quality of work done in the field, should show commensurate improvement.